Una inversión de 3.000 millones de dólares en automatización agrotecnológica podría crear entre 6.000 y 7.000 puestos de trabajo en un plazo de cinco años
He estado analizando cuáles serán los niveles de financiación de capital riesgo en los próximos cinco años (2026-2030) y qué impacto podemos esperar que tenga la inversión en automatización en la creación de empleo. Esto tiene implicaciones a la hora de buscar fuentes de financiación alternativas (es decir, ajenas al capital riesgo), ya que el desarrollo económico suele ser un argumento que puede ayudar a conseguir muchas fuentes de financiación públicas, incluidas las subvenciones y la financiación de programas de desarrollo económico.
The first step is to look at the amount of AgriFoodTech venture capital that is likely to be invested over the next five years. To do that, we can look at the drop over five years from $53B in 2021 to ~$10B for 2025 and then look at the underlying root causes of the drop to determine where VC funding levels are likely to go the next few years. I continue to believe that venture capital faces structural challenges, despite strong AI funding and valuations. These challenges stem from a lack of quality exits driven by a sharp decline in IPOs and startups remaining private longer for reasons that are unlikely to change. These structural challenges exist for AgriFoodTech as well, and when you add to them the fact that 42% of the $53B were in two over-hyped categories that generated virtually no exits the past five years (CEA and alt-protein), it’s easy to come to the conclusion that $10B is not an outlier but the new normal until exits return.
If we start with $10B as a 2026 baseline target, where do we go from there? To keep things simple, I assumed a flat-line trend for five years (overly simplistic to get to next-step actions). For the first step, I used $50B ($10B/year for five years) as our starting point.
For the second step, we need to look at how much of that investment amount is likely to go to automation. For this model, I looked at data from a previous post that looked at the investment percentage for AgriFoodTech that automation represented.
Automation accounted for 8.3% of AgriFoodTech funding in 2015, then declined sharply as overhyped categories like CEA and alt-protein captured 42% of funding in 2021. Over the past two years, automation has rebounded to 4.9% and 4.8% and is positioned to gain share as CEA and alt-protein downsize and automation startups continue solving real-world grower problems. I put the percentage of AgriFoodTech funding that goes to automation at 4-7% with a likely forecast of the upper half of that bound.
For this model, I used a flat 6% for all five years because while I think automation will continue to gain share of invested funds, I do not think it is going to go to levels like 8-10% of total spend. Also, just like AgriFoodTech, it’s likely to see significant gains on a relative basis but not likely to double or more from current levels without a real change in exits (possible but not likely given market conditions now). So, if you take a 6% allocation to automation for five years across $50B, you get a total automation investment of $3B for five years.
Now that we have a $3B target, the next step is to look at the investment spending for fundraising segment from seed through A and B VC rounds and beyond. This will help us match up the job creation profiles with the appropriate segment investment percentage. It shouldn’t surprise anyone that there are different needs for seed round raises between A and B rounds. We want to factor that in.
This is where the data gets interesting. I know, it was always interesting but there’s a complete sea change in early stage v late stage investment, and that has ramifications for this analysis. Specifically, in 10 years, the split has gone from 78% to seed and Series A startups and 28% to Series B and later to the exact opposite. This means that while roughly 4 out of 5 dollars 10 years ago were going to early stage startups, that number is now just 1 in 5. By comparison, the funding going to later stage startups (again B round and later for this exercise) is now at 78% and takes up 4 of every 5 AgriFoodTech VC investing dollars. This means that most of the job creation that is likely to happen across our $3B in five years will match the profile of B round investments.
The next step is to look at the jobs created at each tier with a range of job creation expected. This part is a work in progress. Getting good sector comparisons is tough, so I am going to keep working on that. There are some big differences in VC capital allocations by startups in spaces like online advertising (primarily software and analytics tools) and fintech (payments tech – again more software) compared to AgriFoodTech generally and in particular when compared to automation. Every automation solution has research and development (R&D) that requires hardware R&D and cost of goods sold (COGS) that requires buying parts and completing assembly for each robot.
For now, I am getting comfortable with the analysis I am providing details on here as a starting point, acknowledging that this will evolve. In short, the labor share of spending varies by overall segment (AgriFoodTech vs. other VC investment categories), the sub-segment (automation vs. other), and the round of the fund raise (i.e. the more you spend on COGS and manufacturing generally the less you spend on people, and it is fair to expect that a B round will have more manufacturing costs associated with it than a seed round because you should be doing production to get to commercialization and scale.)
For this initial analysis, I broke investments down into: (1) seed; (2) A round; and (3) B round and later. For segmentation purposes, we used $1-2M as the range for seed rounds, $5-15M as the range for A rounds, and $20M+ as the range for B rounds (and as I write this I realize the $2-5M and $15-20M gaps need to be analyzed to make sure we’re not eliminating anything inadvertently – stay tuned). With those segments, it looks like $3B in automation VC investment across 2026-2030 should create 6,000 – 7,000 total jobs. That breaks down as (1) 4,500 direct engineering, manufacturing, deployment and field service jobs (direct jobs) and (2) 2,000 – 2,500 indirect and induced jobs (indirect jobs) over the five-year period. It also means that $3B creates 25,000 – 30,000 cumulative jobs years.
Across the three segments, here is the current set of assumptions. For seed stage investments, the job creation range across the entire five-year period is 750 – 1,500. For A round investments the job creation range is 1,500 – 3,000. For B round (and later) investments, the job creation range is 2,100 – 4,200. I want to work on these three segment numbers more, but for now, these seem directionally right and tie to some quick bottoms up analysis. If you look at the total number of jobs created as 6,500 (midpoint of the 6,000 – 7,000 range), that means that at $3 billion in VC investment the investment level per job is ~$461k. Said another way, for each $1 million in VC investment, there are 2.1 jobs created. Both of these numbers are rational. Remember it’s not like the average salary is $461k – that number factors in the other non-people costs related to R&D, engineering and manufacturing, which are not people costs. Similarly, while two head count per million seems low, it is not when you factor in all the hardware costs mentioned above.
It’s worth spending some time on the direct vs. indirect topic. The direct jobs are defined in this analysis as jobs that would not exist without the automation firms themselves or as jobs created inside ag automation companies and their immediate operating footprint as a result of the VC investment. Direct jobs would not exist without the startups and include robotics and automation engineers, manufacturing and assembly workers, field deployment and service technicians, product management (including QA and testing), sales and support, and operations and supply chain head count.
By contrast, indirect jobs are positions created outside the startup but are required to support their production, deployment and ongoing operation. Critically, the jobs arise through supplier and service demand and are not directly on the automation firm’s payroll (thus indirect). Included in the indirect category are component suppliers that make the parts for the automation startups, contract manufacturers and fabricators, logistics and transportation, installation contractors, maintenance and repair firms, and professional services (accounting, legal) that support the startups. None of these costs are on startups payrolls but all are required to support the startup and its activities. As you can see from this model, we are using a 1.5x multiple on direct employment to calculate indirect employment.
After all that definition language, you’re probably wondering what is explicitly excluded from the direct and indirect calculations. Here’s what is not counted: on-farm labor reallocation (i.e. increased efficiency lets farm workers do new and different tasks), productivity-driven output expansion on farms (i.e. any jobs created from yield or margin gains because of the automation), and retail or export-related employment (considered part of the ecosystem but too tenuous to be counted as indirect in the above analysis).
This part one of the analysis. There will be future parts as I get a chance to dive deeper. For now, here is the best summary of what the job creation for the specialty crop agtech automation over the next five years could look like:
If you assume 6% of the $50 billion forecast for AgriFoodTech VC from 2026-2030 is invested in AgTech automation startups, that means that $3 billion ($600 million per year) gets invested and creates 6,000 – 7,000 jobs: 4,500 direct engineering, manufacturing, deployment and field service jobs and another 2,000 – 2,500 indirect jobs for a total of 25,000 – 30,000 cumulative job years. From an economic development perspective, these numbers (and the evolved version in the future) can be used to support grant funding and other public funding from state and federal agencies focused on economic development returns.
To that end, I am doing some analysis of grant funding around innovation and economic development to determine how much of an accelerator impact they can have and what is the right way to deploy them. The early research suggests they can be very catalytic and that the likely best location to put them is not on early stage R&D but on the commercialization activity set. Specifically, and I believe this is the largest opportunity for US educational ag systems to evolve, if we switch even a small but meaningful portion of funding away from R&D and research paper output to focus on commercialization.
Specifically, there is an opportunity to really dial up the intellectual property (IP) capture, licensing, and tech transfer metrics and build out the infrastructure around all of that. It is the under-served portion of the innovation funnel that likely has the highest ROI if we can build it right. When we build it right, we widen the funnel of VC-capable startups by getting more research output to commercialize and that is a win for the entire agtech ecosystem. But that is the subject for a future article (ok, more likely for many future articles!).
Más información sobre la próxima generación de trabajadores de AG
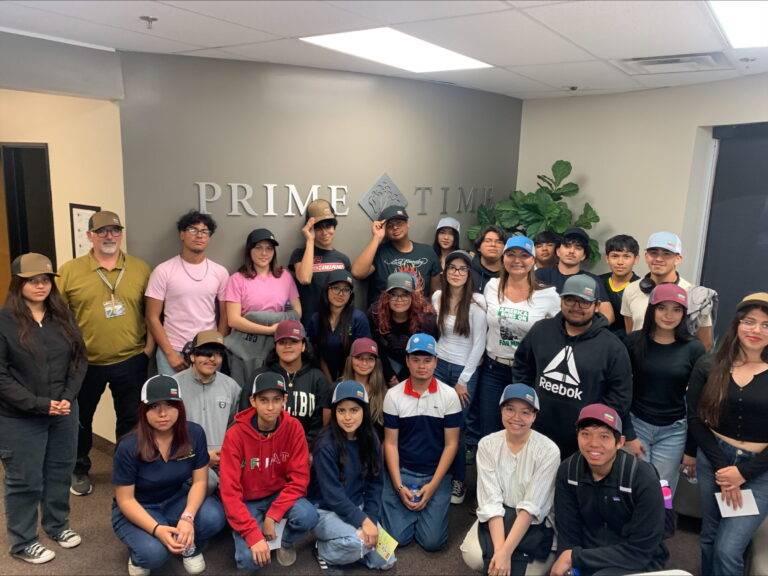
Western Growers y California Women for Agriculture Coachella Valley Chapter organizan una gira de carreras agrícolas para estudiantes
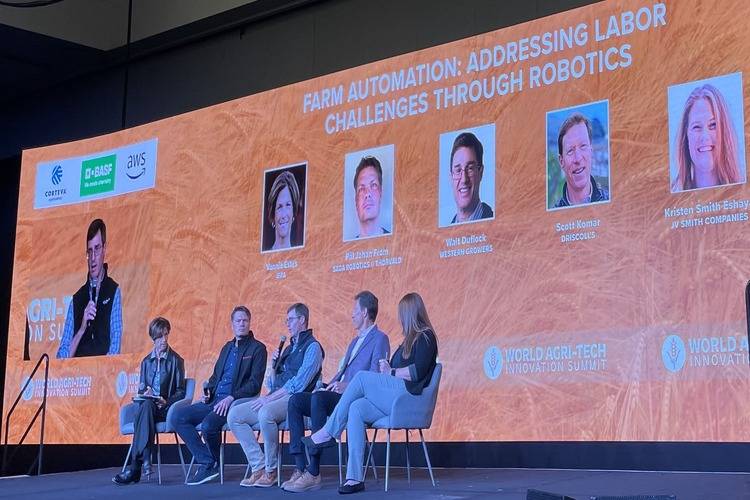
Walt Duflock, de WG, participa en el panel sobre automatización agrícola de la Cumbre Mundial de Tecnología Agrícola de San Francisco
FARMX: Revolucionando la agricultura

Walt Duflock habla del futuro de la agricultura californiana con The Modern Acre Podcast
