USDA Ag Outlook Panel – Keeping the Automation Funnel Healthy with Economic Development Federal Grants
Last week was a great week for specialty crop automation in Washington, DC. Big thanks to Chris Purdy, the Chief Innovation Officer at USDA Agricultural Marketing Service (AMS) for setting up a panel on specialty crop labor challenges and automation and innovation opportunities for me, Western Growers Senior Director of Automation and Commercialization Ben Palone, and Reservoir Farms Founder and CEO Danny Bernstein. The key message was around the economic development opportunity that combines agriculture and AgTech opportunities.
I opened with the usual problem statement around labor: the lack of domestic availability has pushed H-2A usage up by three times in five years, and H-2A now represents 10% of California’s farm work force and that is out of a total $16.3B spend in 2024. The H-2A labor fully loaded costs growers $28-30/hour because of housing, transportation, and food costs. Meanwhile, regulatory costs (Cal Poly data) have risen from $109/acre/year (2005 leafy greens research) to $1,600/acre/year (2024 data—same grower, same farm, same crop). Because of the cost challenges, California is forecast to lose 32% of farming acreage and 51% of California growers over 55 years (1997 – 2052). Washington state is forecast to lose as well, but by less (25% of acreage; 33% of farms).
Regions like Peru are making very different policy decisions than California around labor, water, infrastructure, and economic development. In addition, Peru has set explicit targets publicly of $40 billion in ag exports for 2040 and 1 million new hectares (2.47 million acres) by 2040. This is after Peru grew ag exports from $465M in 2000 to $12.7B in 2024 (1,869%) while California grew 129% to $22.4B over roughly the same period.
From an automation perspective, two thirds of hours are spent on harvest and one third of hours are spent on non-harvest. We are making progress on non-harvest automation, which looks like it grew from $250M to $310M (24% YoY) from 2024 to 2025. At that revenue level, automation is helping to reduce labor required by 3-5%. If you straight line the growth rate for the segment at 24% and push it out through 2030, specialty crop AgTech automation becomes a $900M category in North America. We are confident that with the international players included, the category goes over $1 billion in revenue in 2030. At $1B in revenue, most technology segments create complementary opportunities in systems and operations integration (25-30%) and data and analytics tools (20-25%). In short, a $1B automation category likely supports another $500M in related revenue.
On harvest, the picture is not as positive. Venture capital has dropped from $53B in 2021 to $10B in 2025 (85%). The short version is the entire venture capital work shrunk by 50% ($354B to $171B from 2021 to 2023) but got rescued (as often happens in tech investing) by the AI segment, which pushed venture back over $200B by itself even though IPOs dropped 85% from 2021 to 2023 (1,046 to 153). The lack of liquidity outcomes from IPOs has not dampened anyone’s interest in AI investments or valuations that appear to be many to be a bit bubbly (we’ll see on that one).
This lack of venture capital means fundraising for AgTech startups is as challenging as it has been in a long time. AgTech did not get an AI bump (in fact, you can argue it takes an AI hit in some ways because the cost of engineering talent is being driven up massively the last couple of years from the AI arms race in the form of engineering recruitment and retention) and 42% of the $53B in 2021 was from two categories (vertical farming and alternative proteins) that I have not been kind to and will remain critical of because they took billions of dollars and basically lit them on fire for multiple years with virtually no good outcomes. As a result, the capital available and margin for error for AgTech startups is very small at the moment – the team, the product, the strategy, and the revenue metrics must all line up and the pitch needs to be stellar.
Given the lack of outcomes in harvest automation to date, we are concerned about the ability of harvest to secure venture capital and are engaging in alternative capital strategies. One of them is to learn from the Strawberry Commission, which looked around over ten years ago and realized that every activity that needs automation in strawberries is too small for venture capital investments (the market size is too small) except harvest. So they prioritized the other activities (hole punching, strawberry de-topping, etc.) and used industry capital to fund professional engineers and house them at the Cal Poly Strawberry Center where they work with student teams on R&D for solutions to each of these problems. The program is working well, with three projects getting past R&D and to commercialization with an open source strategy where the drawings and equipment specifications are made available to growers who can give them to whichever Central Coast OEM they want to use.
We are leveraging a similar approach but moving forward with a Product Requirements Document (PRD) and Request for Proposal (RFP) process for existing OEMs instead of student teams because of the complexity involved with harvest (with a particular focus on the end effector and software to do the picking/harvesting and placement in a bin or product holder). The PRD for the initial project is being developed right now for iceberg lettuce harvest automation. Rhishi Pethe is helping by taking on the PRD effort for us. Grower feedback and field visits have given Rhishi much of what he needs to complete the PRD, and we anticipate completion in the next 5-7 weeks. After that, part 2 is to take the PRD and turn it into an RFP that OEMs can respond to which we will launch within 3-4 weeks of PRD completion. By May, we should have the RFP process live and OEMs will have 60 days to respond. That means we hope to have all responses in by July and we can select the most likely winner candidates and work in a group to debate strategy and approach before coming up with one final RFP winner. As with Strawberry Commission, this process will require no venture capital and will use industry capital and grower feedback to maximize the chances for success.
There are multiple approaches in play. For non-harvest, we believe the category can become $1 billion by 2030 (particularly once we open the global lens up) with venture capital investments. This would mean we would have automated somewhere between 15-20% of non-harvest activity. For harvest, we believe a grower collaborative capital model and PRD/RFP can open up alternative capital sources and help us get from the current 0-1% that is automated to something closer to 3-5%. All of that supports innovation funding from many of the traditional sources, including USDA, CDFA, and SBA. Everything up until now in this article has been a long preamble summarizing the work of Ben Palone and I the past few quarters.
But here’s where things get really interesting (I know, a thousand words in – sorry, I think the above is needed to set the stage for what follows). I took a look at a couple of items involved with the venture investing funnel and instead of focusing on startup revenue results and commercialization, I focused on the capital needed to keep the innovation funnel healthy and (more importantly) took a look at the economic impact as measured by jobs created and job years delivered. My thesis was that we should reposition AgTech investments from both venture capital and grant funding around an economic development thesis with jobs as the key metric. That thesis appears to be correct as I gather more data.
To start the process, I estimated the amount of venture capital that AgriFoodTech is likely to get in the next five years (2026-2030). Based on the drop from $53B to $10B and current under-performing trends for exits overall, most of my investor friends and I believe that AgriFoodTech is likely to stay in the $8-$12B/year range for a few years until exits start to become more common. That is unlikely to come via IPO because AgTech does not grow revenue fast enough and large enough to support the metrics needed for an S-1 filing. Therefore, the most likely exit path to see some growth on is M&A and that is not likely to continue until the OEMs (John Deere, Case New Holland, et al) are in a financial position to support more acquisitions. Based on all of that, I am forecasting the 2026-2030 AgriFoodTech venture capital at $50B ($10B a year – the midpoint of the estimate above – straight lined for five years). I believe $50B is a conservative estimate that is more likely to have upside over the next five years.
Part two of the exercise is to estimate how much of the $50B will be invested in automation. For this, I looked at the last couple of years. The short version is that 4-7% looks to be the recent trend, and with the CEA/alt-protein money going away, it is trending towards 7% and likely to go higher. Unlike CEA and alt-protein, automation is solving a real problem – maybe the biggest problem facing California growers – labor challenges. For this forecasting exercise I chose to straight line 6% per year for the entire five years. I believe this is another conservative estimate that has upside more likely than downside the next five years. If $50B is our forecast for VC and 6% is out automation percentage, we have a total forecast for automation investment of $3B.
With the $3B established, the next part of the exercise was to figure out how much job creation AgTech is likely to establish on the back of the $3B investment. After some analysis comparing AgTech to other tech segments, the prediction is that $3B in AgTech automation investment over five years can create 6,000 – 7,000 total jobs. That breaks down into two groups. First, 4,500 direct jobs are created, including engineering, manufacturing, deployment, and field service jobs at the startups that received funding. Second, 2,000 – 2,500 indirect jobs are created in supporting industries that are not on the startup’s payroll but support it.
Next, I took a look at the mix of VC funding across investment levels from seed rounds through A rounds through B rounds and above. The main reason for this is different rounds create different headcount expectations. That is even more true when manufacturing is involved. Early on, you can pay more for engineering headcount for R&D, but as product gets to commercialization the amount needed for manufacturing goes up and people cost has to decrease. So each round has different profiles of hiring. Here’s another interesting point. Because of the complete drop off in VC, the amount invested in seed and A rounds compared to B rounds and later has completely flipped in 10 years. It was 78% seed and A rounds in 2015 and 22% B rounds and later. In 2025, that flipped to 22% seed and A round and 78% B round and later. This makes sense because as capital dries up many VCs follow their instincts and strive for portfolio protection – i.e. let’s continue making investments in companies we already know and have invested in and avoid making new bets.
The problem with that is that there is an established ratio between early stage rounds and later rounds to maintain a healthy innovation funnel. In short, you have to plant a lot of acorns over years (seed and A rounds) to get a lot of trees that can use and need larger amounts of capital years later. That is not what is going on with portfolio protection. In fact, if left in its current state, the funnel would start to be in poor health fairly soon.
So what is the ratio for AgTech? Well, you need to factor in the extensive hardware development cycles that often include multiple prototype cycles, the fact that field validation often takes multiple seasons, and the reality that exit pathways (the aforementioned IPOs and M&A) are slower and fewer than software sectors. When you account for all of those, AgTech requires .75-1x early capital per $1 of B round and later investments. In short, for every B round dollar you need 75 cents to a dollar in seed and A round to keep the innovation funnel healthy. If 78% is invested in B rounds and later and $3B is the total automation investment, B+ rounds represent $2.3B and seed/A rounds represent $660M ($.66B). But the early capital needed for funnel health is somewhere between $1.8B and $2.3B, so the existing 22% we can expect ($.66B) leaves a capital shortfall of between $1.1B and $1.7B.
Where can we make up the shortfall left by a venture capital total for the category that is shrinking and over-weighted toward B round and later startups? Well, we could look at grants, and both federal and California grants are in play. If we look at the economic development grants, the federal side is where most of the action is. If you combine the fiscal year (FY) 2024 funding across multiple categories, you get to $4.7B – $5.2B. First, Economic Development Administration (EDA) provided $1.14B. Second, Economic Development Initiative (Community Project Funding) provided $3.29B. Other federal economic development grants from DOT (Department of Transportation), DOE (Department of Energy), USDA (US Department of Agriculture), and RD (Rural Development) provided money. Depending on how startups are classified, there can potentially be access to all four of these categories.
By comparison, California provided $120M for GO-Biz and California Competes grants (using state dollars across multiple sectors), $17.5M for GO-Biz (additional grants) and Jobs First, and $23.3M for CDFA Specialty Crop Block Grants (which deserves an asterisk, this is the administration of USDA funds at the state level). Finally, the US provides USDA Specialty Crop Block Grants ($72.9M and Multi-State Grants ($9.4M) for a total of $82M). You quickly see that the majority of the grant dollars are in Federal Economic Development from EDA, EDI (CPF), and the four horsemen of DOT/DOE/USDA/RD at $4.7B – $5.2B.
If we take a look at the five-year estimate for this federal grant total, it’s a little challenging because there are things that could lower it (i.e. DOGE, budget allocations) or raise it (budget allocations, revised strategic priorities – i.e. MAHA). If we just go with a straight-line estimate at the mid-point, you come up with a five-year estimated total of $25B ($5B x 5 years). Of course, this is for multiple industries and multiple departments, so it is very competitive. For now, we’ll use $25B as the five-year federal funding target estimate.
We know that for $50B of AgriFoodTech VC, we can expect $3B (6%) in automation funding. That will create 6,000 – 7,000 jobs. It will also lead to a shortfall of $1.1B – $1.7B required for a healthy innovation funnel because portfolio protection means 78% of the $3B ends up in B round and later investments. If we then source an additional $1B from federal grant funding (roughly 4% of the total available funding expected over five years) and look at the expected job count, I am estimating that an additional 2,000 – 3,000 jobs can be created if the $1B were focused on mid-stage innovation (licensing, IP, technology transfer, commercialization) instead of early stage and primary R&D. This has the benefit of both preserving the health of the automation funnel while providing a significant count of incremental jobs. The combined totals with the $1B in grant funding are that $4B split 75%-25% between VC and federal grant funding over 5 years can create 8,000 – 10,000 jobs over 5 years and a total of 40,000 – 50,000 Jobs-Years. This is a significant amount of rural economic development in agriculture communities everywhere specialty crops are grown.
From here, I plan to do a few things to advance the research. First, I am going to look at other economic development funding to see what kind of metrics there are for other grants in terms of job creation to see how competitive this overall proposal is relative to other similar grants. In short, are we capital-efficient job creation relative to our peers? Second, I want to look at the breakdown of federal funding to see how much and how best to deliver grants that can land the right amount of funding to help with the shortfall. Third, I want to measure ag GDP as a percentage of overall US GDP to see what kind of pro rata investment spend we would expect if every industry received the same % of funds as their % of GDP represented.
For now, I am confident that this economic development strategy provides availability of far more funding than innovation grants and food security provides. I am increasingly growing confident that the economic development metrics around rural jobs that this proposal provides will put AgTech in a competitive position with other grant applicants. I’ll share more of what I’m finding as I dig into the issues above.
More about Next Gen AG Workers
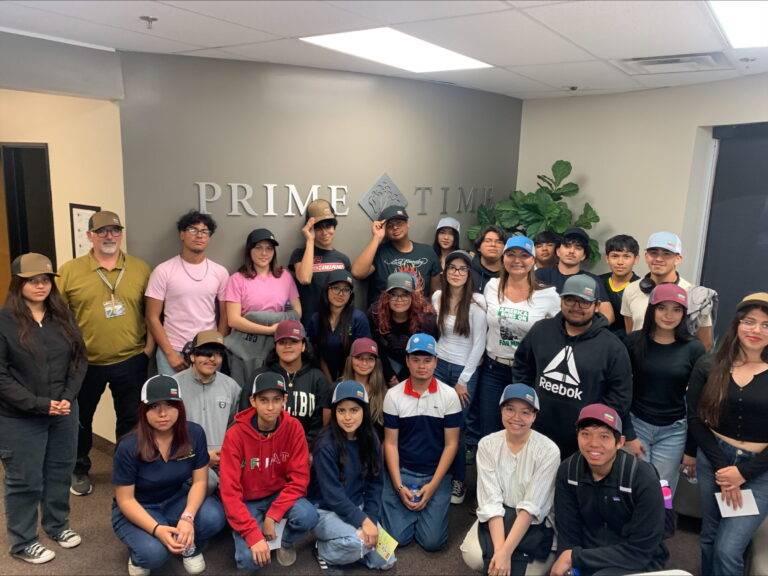
Western Growers and the California Women for Agriculture Coachella Valley Chapter Host Student Ag Careers Tour
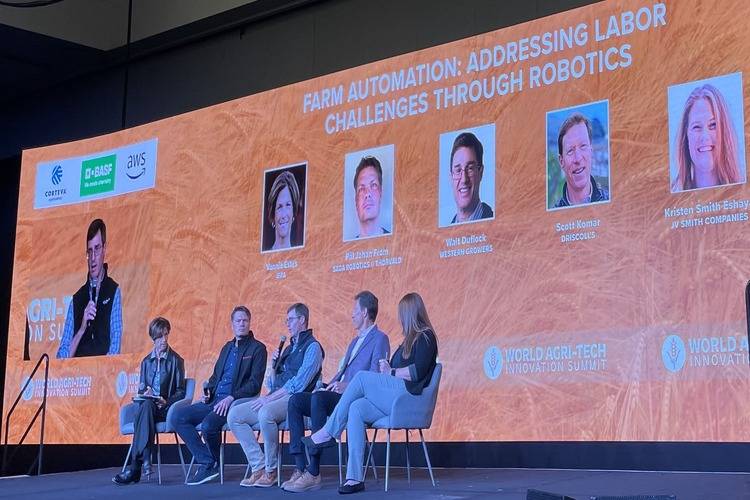
WG’s Walt Duflock Joins Farm Automation Panel at World Agri-Tech Summit in San Francisco
FARMX: Revolutionizing Agriculture

Walt Duflock Talks the Future of California Ag with The Modern Acre Podcast
